How to Classify Time Series Signals With Computer Vision: Kaggle Whale Example

We are constantly surprised by the various ways our customers use our platform. One such use case that caught our attention is using image classification to analyze time series signals. In this blog post, we’ll demonstrate one approach to accomplish this by guiding you through building an image classification function to classify audio clips, a form of time series signals.
The challenge
The challenge we aim to solve in this post is Kaggle’s whale detection challenge. The dataset provided with this challenge includes underwater audio recordings, some of which contain North Atlantic right whale calls. The goal is to classify the audio clips as containing or not containing a right whale call. Let’s try it out with an image classification function.
Turning audio clips into images
Time series data is generally a series of numbers representing amplitudes of the signal along the time series. In the case of the whale dataset, each audio clip is 2 seconds long and is sampled at 2kHz. This means that each clip is a series of 4000 numbers. To solve the challenge using image classification, the first thing we’ll have to do, of course, is turn the time series signal into an image. We have a few options for doing that:
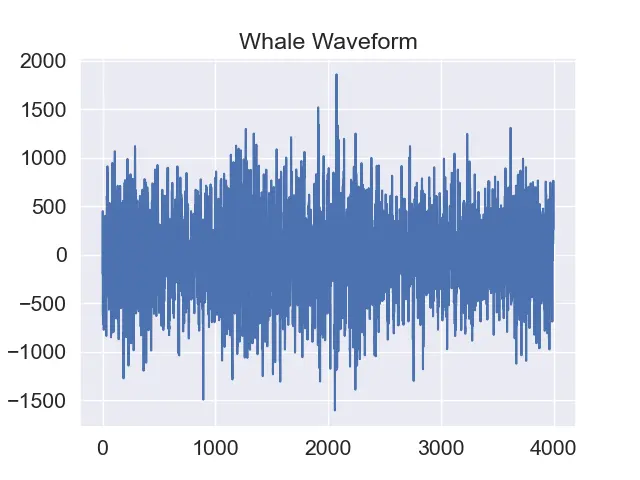
- Plot the waveform with amplitude on the x-axis and time on the y-axis. This is the easiest method and can produce good classification results in some cases. See an example of such a plot below:
- Spectrogram: A spectrogram is a visual representation of the frequencies present in a signal, with time on the x-axis, frequency on the y-axis, and the amplitude at each frequency represented by color intensity. This method exposes a lot more information about the signal in image form, and it’s the method we’ll use in this post. You’ll see example images of spectrograms further down.
- Mel spectrogram: This is a variation of the spectrogram that uses a non-linear frequency scale on the y-axis, called the mel scale, which more closely mimics human perception of pitch. Automatic speech recognition models, like OpenAI’s Whisper, commonly use this method.
Creating spectrograms
The complete code for this post is available here as a python notebook. Let’s look at the code we use to convert audio files into spectrograms using matplotlib:
# Helper class for creating a spectrogram from an audio signal
class Spectrogram:

    # Open an audio file and return the time series and sample rate
    def get_time_series(self, image_path):
        s = aifc.open(image_path)
        n_samples = s.getnframes()
        sample_rate = s.getframerate()
        strsig = s.readframes(n_samples)
        values = np.frombuffer(strsig, np.short).byteswap()
        return values, sample_rate

    # Create a spectrogram from the time series and sample rate
    def plot_spectrogram(self, image_path, plot):
        series, rate = self.get_time_series(image_path)
        f, t, Sxx = signal.spectrogram(series, rate, nperseg=256, noverlap=224)
        plot.pcolormesh(t, f, Sxx)

    # Save the plot to a byte array
    def get_plot_bytes(self, plt):
        with io.BytesIO() as buffer:  # use buffer memory
            plt.savefig(buffer, format='jpg')
            buffer.seek(0)
            return buffer.getvalue()

    # Process an audo file and return the spectrogram as a byte array
    def process_audio(self, image_path):
        fig = plt.figure()
        self.plot_spectrogram(image_path, fig)
        plot_bytes = self.get_plot_bytes(fig)
        fig.close()
        return plot_bytes

spectrogram = Spectrogram()

# Let's look at some spectrograms of whale sounds
fig, ax = plt.subplots(nrows=1, ncols=3, figsize=(20, 5))
fig.suptitle("Whale Spectrograms")
for i, sample in enumerate(random.sample(whale_subset_train,3)):
    spectrogram.plot_spectrogram(trainfolder+sample, ax[i])
fig.savefig("whale_spectrograms.png")

# Let's look at some spectrograms of not-whale sounds
fig, ax = plt.subplots(nrows=1, ncols=3, figsize=(20, 5))
fig.suptitle("Not-Whale Spectrograms")
for i, sample in enumerate(random.sample(not_whale_subset_train,3)):
    spectrogram.plot_spectrogram(trainfolder+sample, ax[i])
fig.savefig("not_whale_spectrograms.png")
And here are a few examples of resulting spectrograms:
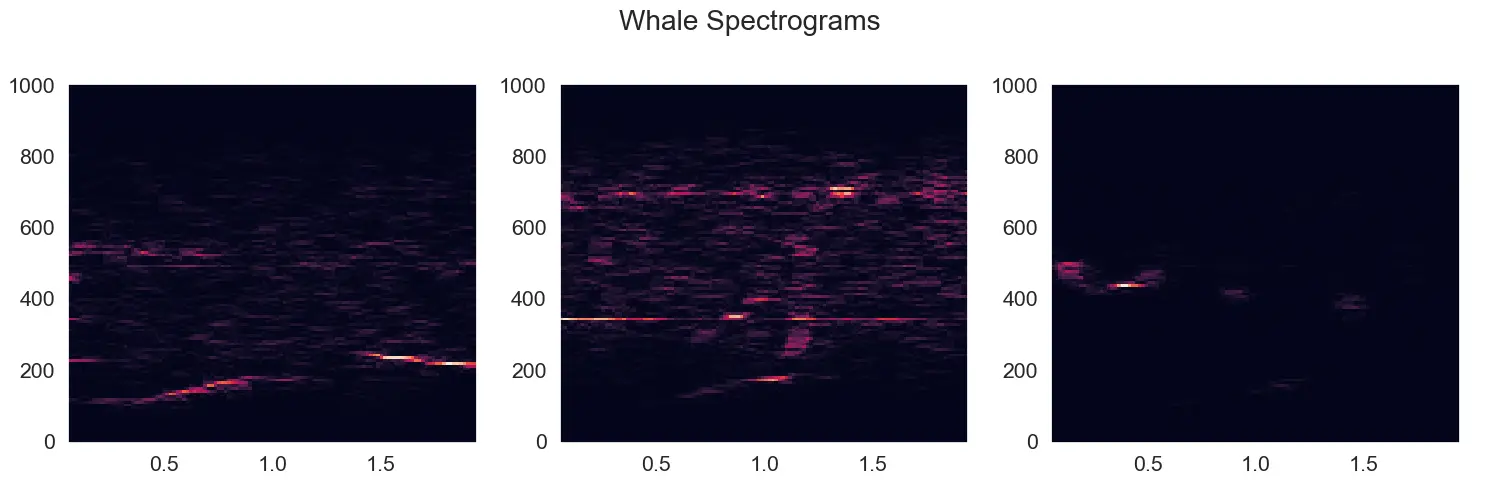
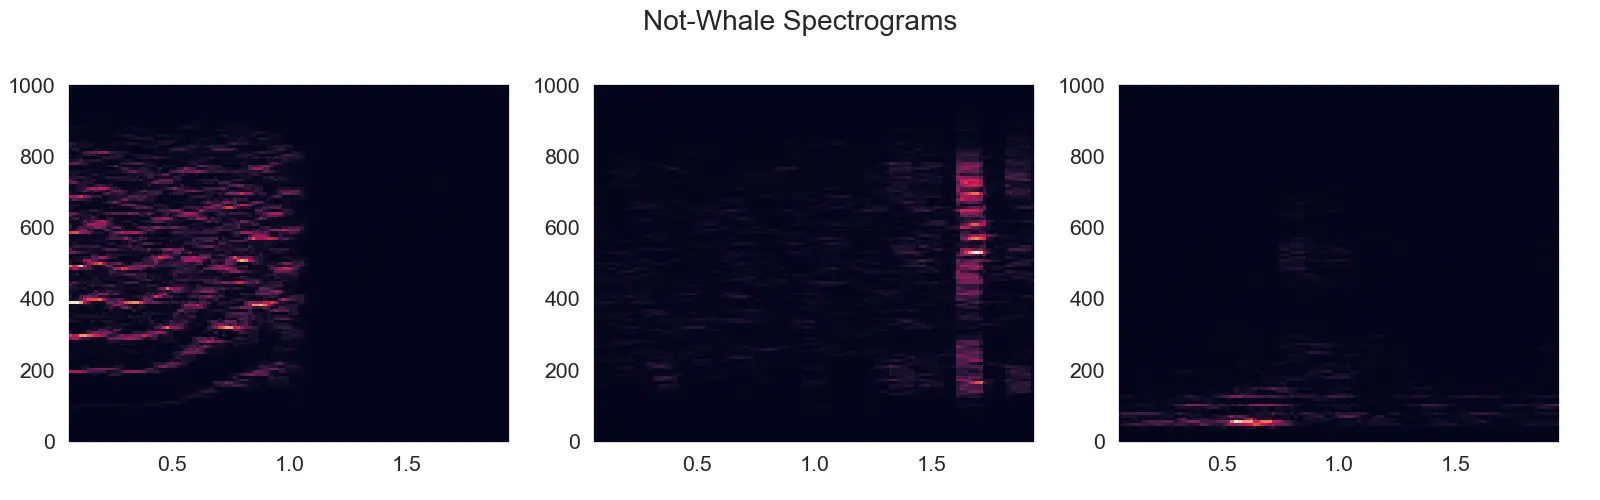
As you can see, there is somewhat of a pattern for the whale calls in the spectrogram - a wisp in the lower end of the frequency spectrum that curves up (increases in frequency) as it progresses. You might also notice the amount of noise present in some of these clips. This is not going to be easy!
Training an image classification function
We are going to use Nyckel’s API to create and train an image classification function from 5,000 spectrogram images - 2,500 with whale sounds and 2,500 without. Here is the code for doing so:
# Create a helper class for nyckel API
# Has methods to create an image classification function, add training samples to the function, and invoke the function to get predictions
class Nyckel:
    def __init__(self, client_id, client_secret):
        self.client_id = client_id
        self.client_secret = client_secret
        self.auth_token = ''

    # Ensure we have an auth token
    def ensure_auth_token(self):
        if not self.auth_token:
            data = {'client_id': self.client_id, 'client_secret': self.client_secret,
                    'grant_type': 'client_credentials'}
            result = requests.post(
                'https://www.nyckel.com/connect/token', data=data)
            self.auth_token = json.loads(result.text)['access_token']

    # Create a new image classification function and add the provided labels (classes)
    def create_function(self, name, label_names):
        self.ensure_auth_token()
        result = requests.post(
            f"https://www.nyckel.com/v1/functions",
            json={"name": name, "input": "Image", "output": "Classification"},
            headers={"authorization": "Bearer " + self.auth_token})
        function_id = json.loads(result.text)['id'].replace("function_", "")
        for label_name in label_names:
            requests.post(
                f"https://www.nyckel.com/v1/functions/{function_id}/labels",
                json={"name": label_name},
                headers={"authorization": "Bearer " + self.auth_token})
        return function_id

    # Encode an image as base64 string for posting to the API
    def base64encoded_image(self, img_bytes):
        encoded_string = base64.b64encode(img_bytes).decode("utf-8")
        return "data:image/jpg;base64," + encoded_string

    # Add a training sample to the function annoated with the provided label_name
    def post_image(self, function_id, image_bytes, external_id, label_name):
        self.ensure_auth_token()
        base64_image = self.base64encoded_image(image_bytes)
        json = {"data": base64_image, "externalId": external_id,
                "annotation": {"labelName": label_name}}
        result = requests.post(
            f"https://www.nyckel.com/v1/functions/{function_id}/samples",
            json=json,
            headers={"authorization": "Bearer " + self.auth_token})

    # Invoke the function to get a prediction for the provided image. Returns the predicted label name
    def predict_image(self, function_id, image_bytes):
        self.ensure_auth_token()
        data = {"data": self.base64encoded_image(image_bytes)}
        result = requests.post(
            f"https://www.nyckel.com/v1/functions/{function_id}/invoke",
            json=data,
            headers={"authorization": "Bearer " + self.auth_token})
        return json.loads(result.text)['labelName']

# Insert client_id and client_secret for nyckel below
client_id = ""
client_secret = ""
nyckel = Nyckel(client_id, client_secret)

# Create an image classification function with labels "whale" and "not whale"
function_id = nyckel.create_function("whale_test", ["whale", "not whale"])
print(f"Created function {function_id}")

# Add training samples containing whale sounds to the function
print("Adding whale samples")
for sample in whale_subset_train:
    filename = trainfolder+sample
    image_bytes = spectrogram.process_audio(filename)
    nyckel.post_image(function_id, image_bytes, sample, "whale")

# Add training samples without whale sounds to the function
print("Adding not-whale samples")
for sample in not_whale_subset_train:
    filename = trainfolder+sample
    image_bytes = spectrogram.process_audio(filename)
    nyckel.post_image(function_id, image_bytes, sample, "not whale")

print("Done adding samples")
The function trains within a few seconds (yes, really!) after the images are uploaded. Here is a screenshot of the resulting function in our UI:
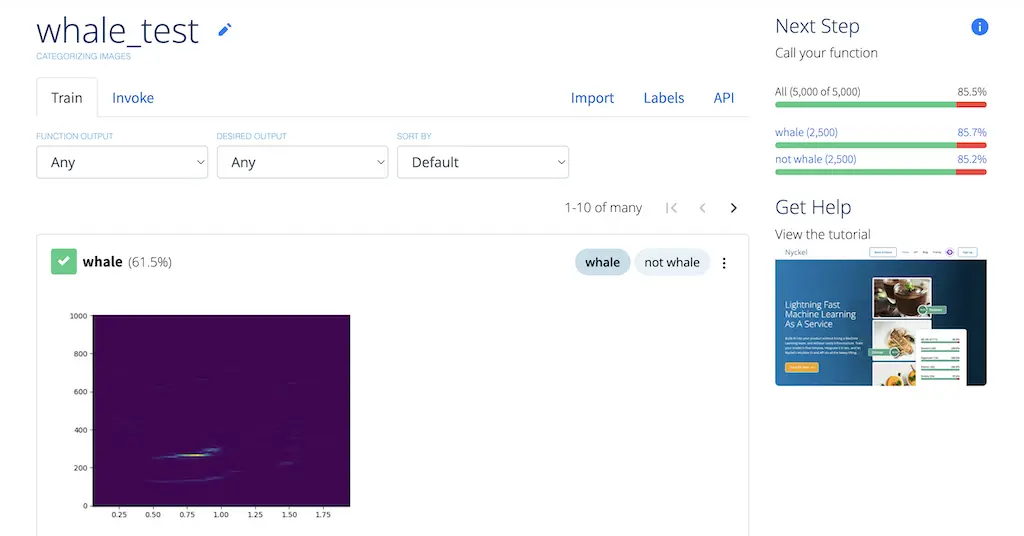
The accuracy bars on the top right of the screen show that we got an ~85% accuracy as measured by cross-validation. Not bad! But let’s check how it does against a holdout test set. Here’s the code we used to call our trained function using 1,000 examples each of whale and “not whale” audio clips:
true_positives = 0
false_positives = 0
true_negatives = 0
false_negatives = 0

print("Predicting whale test samples")
for sample in whale_subset_test:
    result = nyckel.predict_image(function_id, spectrogram.process_audio(trainfolder+sample))
    if(result == "whale"):
        true_positives += 1
    else:
        false_negatives += 1

print("Predicting not-whale test samples")
for sample in not_whale_subset_test:
    result = nyckel.predict_image(function_id, spectrogram.process_audio(trainfolder+sample))
    if(result == "not whale"):
        true_negatives += 1
    else:
        false_positives += 1

print(f"True positives: {true_positives}")
print(f"False positives: {false_positives}")
print(f"True negatives: {true_negatives}")
print(f"False negatives: {false_negatives}")

print(f"Accuracy: {(true_positives + true_negatives) / (true_positives + true_negatives + false_positives + false_negatives)}")
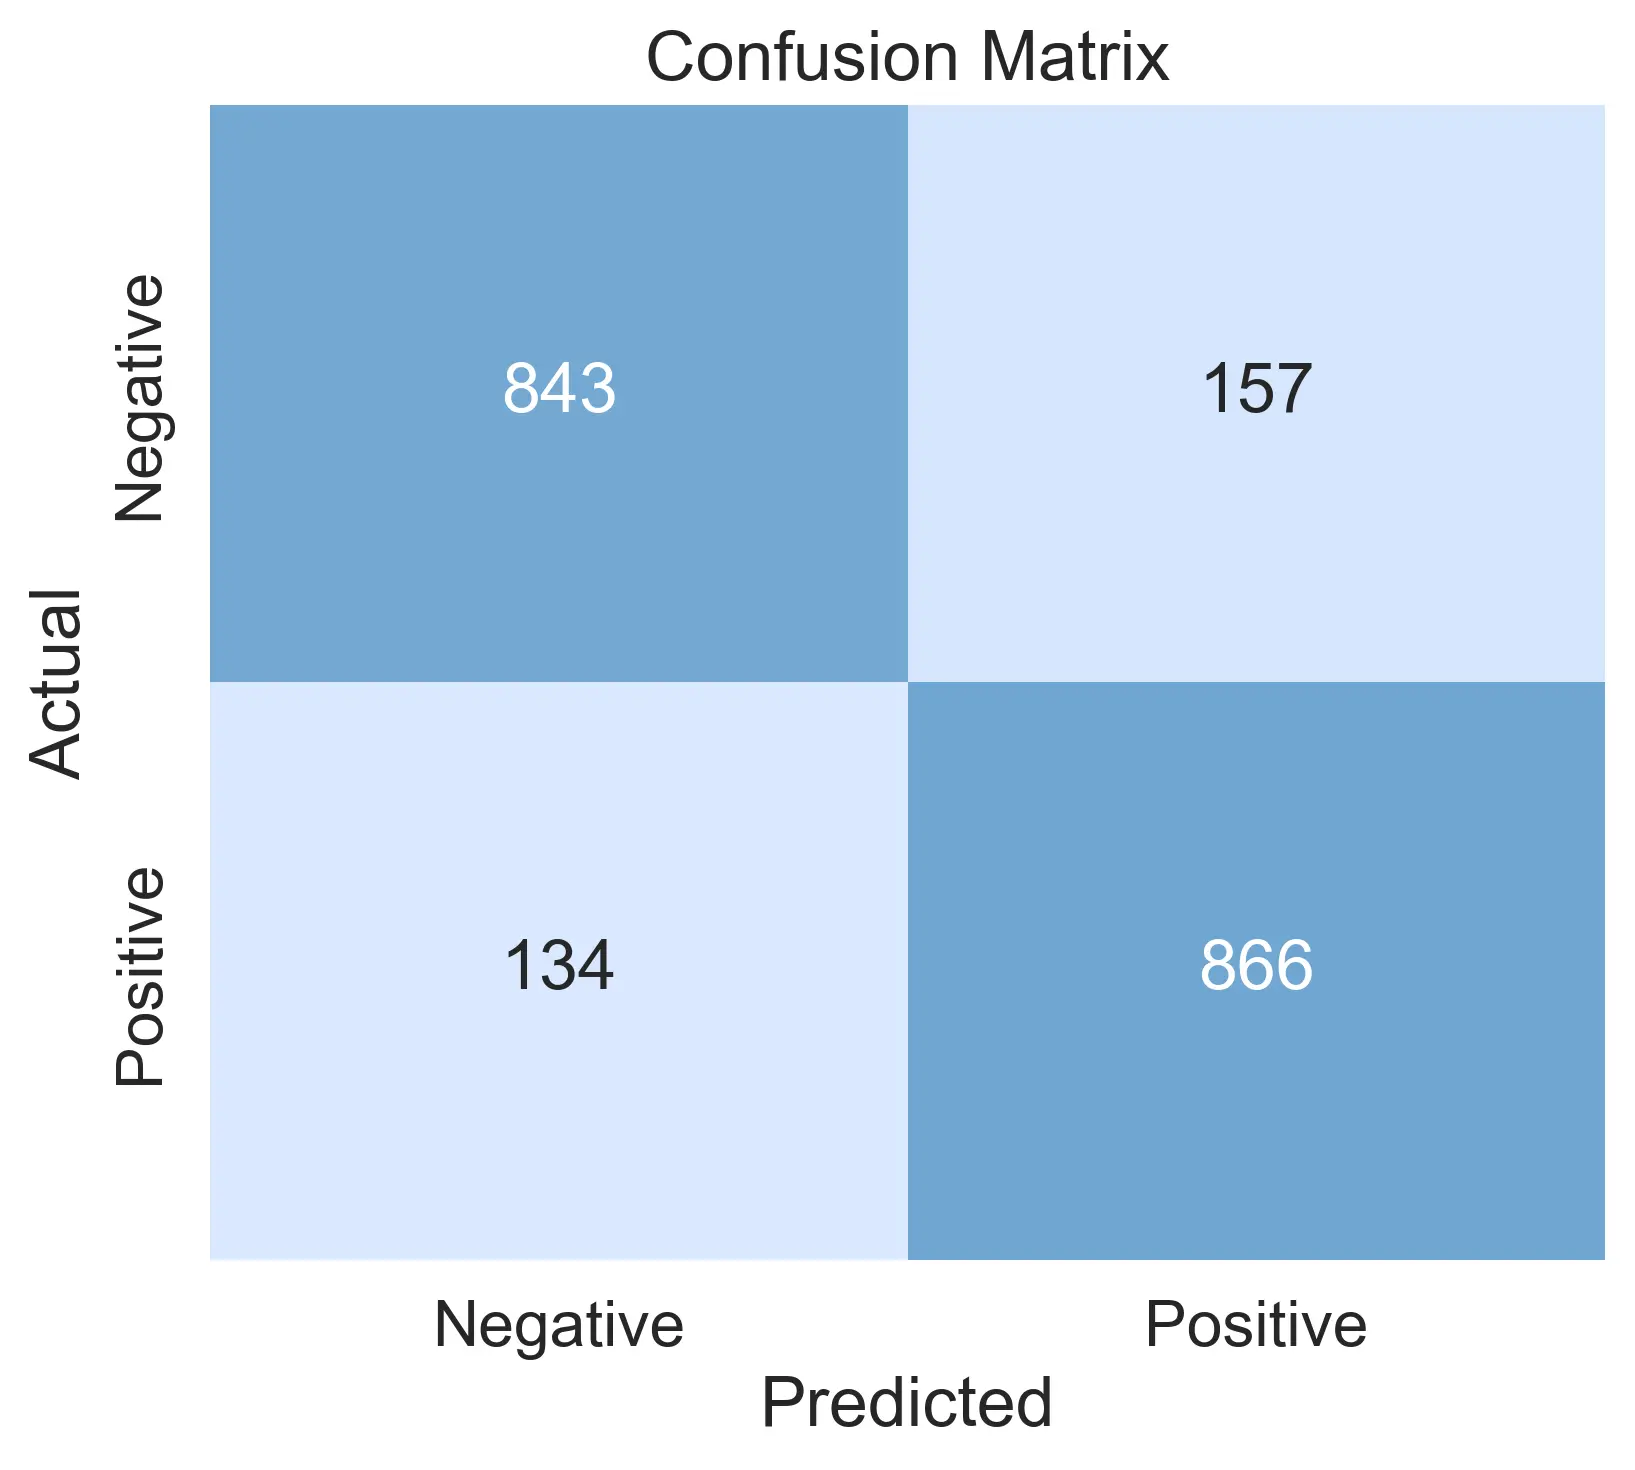
We got an accuracy of 85.45%, which is pretty much exactly what Nyckel’s cross-validation produced. Finally, here is the confusion matrix for the function:
Possible improvements
An accuracy of 85% is not bad for having spent an hour on the problem, with most of it spent figuring out how to create spectrograms. But here are some ideas for further improvements that can be made that could increase accuracy:
- Remove noise from spectrograms. Noise usually shows up as horizontal lines extending all the way through the spectrogram. There are ways to remove this noise, allowing the classification function to have a cleaner signal.
- Focus on specific frequency ranges. It is well-known that right whale calls fall within a narrow frequency range range. We could modify the spectrogram to only focus on that range.
Conclusion
As demonstrated in this post, image classification can be a powerful tool for analyzing time series signals like audio. I hope you found it useful. Sign up for a free account if you’d like to try this technique, or get in touch if you have any questions.