A Quick Guide to Remote Sensing Image Classification (+ How to Build a Classifier)

Remote sensing plays a crucial role in enhancing our understanding of the Earth’s features and our impact on the world around us. Remote sensing technology gathers and interprets information about the Earth’s surface without direct physical contact, typically using various sensors on satellites, aircraft, drones, or other platforms. These sensors capture electromagnetic radiation data, such as visible light, infrared, and microwave signals, which is then processed to yield valuable insights into the Earth’s features and phenomena.
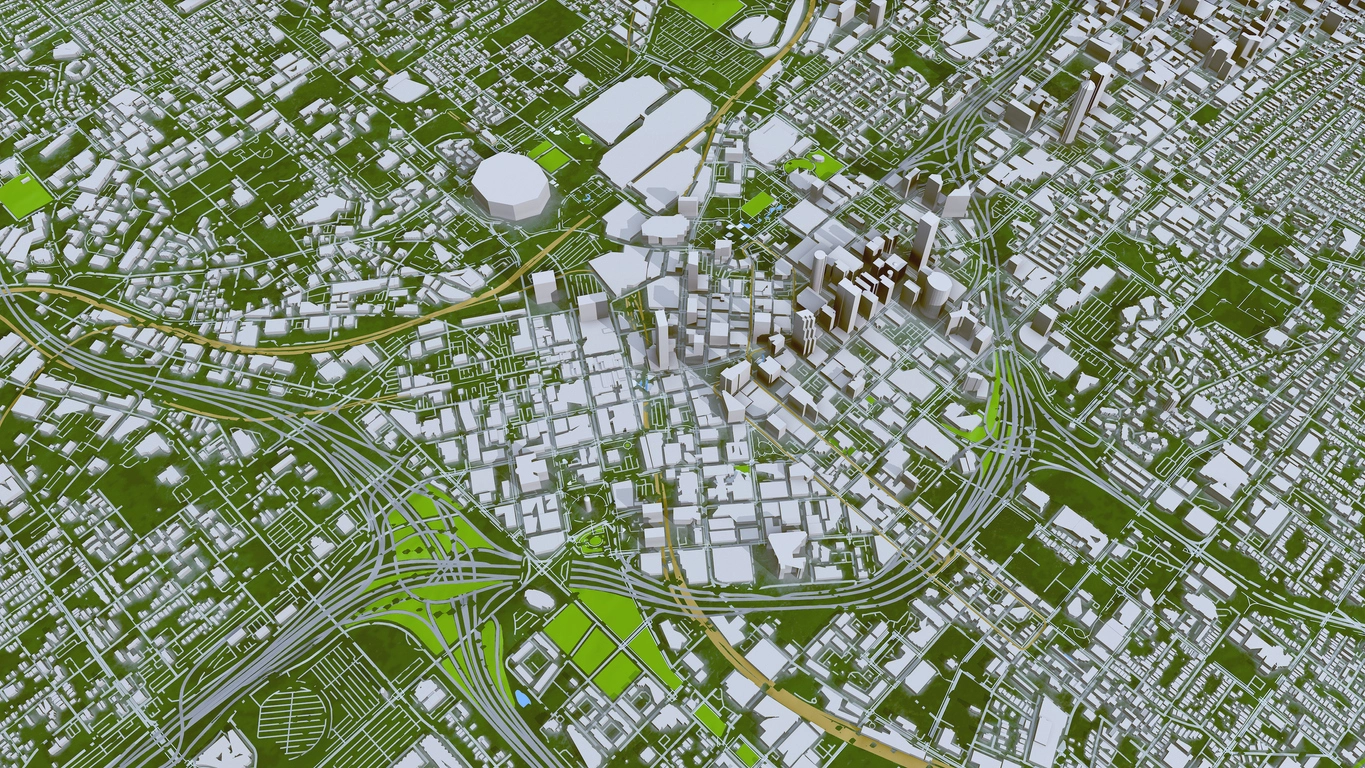
Fields such as environmental monitoring, agriculture, forestry, urban planning, and disaster management use remote sensing to study and analyze changes in land cover, monitor natural disasters, and assess crop health. Environmental monitoring agencies use remote sensing to assess land cover types, vegetation health, and terrain changes, while urban planners use remote sensing images to identify land use patterns, infrastructure development, and changes in built environments.
In this article, we explore how to use image classification to better understand remote sensing data and how to build your own remote sensing image classifier with Nyckel.
Using computer vision to make sense of remote sensing data
Remote sensing typically involves the collection of massive amounts of data. As a result, computer vision algorithms are necessary to analyze and interpret these images. Organizations use computer vision to automate what would otherwise be a manual review of images, which is especially important when the manual review of the data is not feasible. Computer vision algorithms can identify and extract valuable information such as land cover types and changes in terrain or vegetation health. You can also apply these techniques to non-image signals, such as audio, spectral, and radar signals.
You can use machine learning to interpret remote sensing data through a handful of different computer vision function types, including:
- Image classification: Image classification involves categorizing pixels or objects in an image into predefined classes based on their characteristics. For example, classifying land cover types, such as identifying forests, water bodies, and urban areas in satellite imagery.
- Semantic segmentation: Semantic segmentation breaks down the pixels of an image to determine what each pixel is and then tags them based on what category or class they belong to. For example, aerial images of a landscape would identify all the roads shown as: “road.”
- Instance segmentation: Instance segmentation identifies instances of objects within an image, finding the precise pixels that correspond to that object — offering more granularity and precision than semantic segmentation. For example, the landscape image we mentioned above would label each roadway differently (road 1, road 2, road 3). Based on aerial images, you can use instance segmentation to distinguish different vegetation types or identify various plant species in agricultural fields.
- Object detection: Object detection involves locating and classifying multiple objects within an image, pinpointing the location of each detected object either with bounding boxes or a center point. Object detection can help identify specific infrastructure elements, like buildings or bridges, in satellite imagery for urban planning or disaster assessment.
Label remote sensing data with image classification
Although a variety of computer vision techniques are applicable to remote sensing, in this article, we’ll focus on image classification. Even among this subcategory of techniques, there are two types of classification methods – supervised and unsupervised.
Unsupervised classification
Unsupervised classification is a technique where the algorithm categorizes input data without prior knowledge of class labels, allowing it to identify patterns or groupings within the data. In remote sensing, you can apply unsupervised classification to identify natural clusters in satellite imagery, aiding in the discovery of unknown land cover patterns or anomalies, such as uncovering unexpected changes in vegetation or detecting geological formations.
Supervised classification
Supervised classification is a machine learning approach where the algorithm is trained on a labeled dataset, meaning it learns from input data with known corresponding output classes. Supervised classification differs from unsupervised classification because it relies on predefined training data with labeled classes rather than autonomously grouping similar features based on inherent patterns. In remote sensing, you can use supervised classification to delineate land cover types, such as classifying vegetation types or identifying urban areas in satellite imagery.
Once you’ve acquired the necessary labeled data, supervised models are relatively easy to train. Often, they require less data than you’d expect, thanks to transfer learning techniques. Transfer learning allows a pre-trained model, often on a large dataset, to be adapted and fine-tuned for a specific task with a smaller dataset.
Supervised classification has versatile applications in remote sensing, including land-use mapping, environmental monitoring, and precision agriculture. To aid in comprehensive large management and planning, government organizations leverage remote sensing to classify and map different land-use categories, such as agricultural fields, forests, and urban areas. In precision agriculture, you can use supervised classification to identify crop types and assess their health, enabling farmers to make informed decisions about irrigation, fertilization, and pest control.
How to easily build an image classifier for remote sensing data
Image classification is much more accessible than it used to be, thanks to advancements in machine learning and user-friendly image classification tools. To illustrate how you can create an image classifier to label remote sensing data, we’ll create a Nyckel function to distinguish between ships and icebergs. We’ll use the Kaggle Statoil/C-CORE Iceberg Classifier Challenge dataset to train an image classification model using Nyckel.
This dataset includes two JSON files, train.json and test.json, each of which contains a list of images, where each entry includes an image ID, the satellite image data, and the angle at which the image was taken. Additionally, the training samples in the train.json file include whether the image contains an iceberg or a ship.
With Nyckel, you can choose to use the Nyckel Python SDK or do everything from Nyckel’s easy-to-use interface. Let’s start by looking at how to use the Python SDK to train the classification model.
1. Convert radar data to images
First, we need to convert the radar data into images for classification. We can do this using the code shown here.
2. Use Python code to train your model
Once you’ve downloaded the converted images from Kaggle, here is all the code you need to create a Nyckel function:
``` python
import os
from nyckel import User, ImageClassificationFunction
user = User(client_id=”…”, client_secret=”…”)
# Set the paths for the iceberg and ship directories
iceberg_dir = ‘iceberg’
ship_dir = ‘ship’
training_data = []
# Get all the filenames in the folder
for file in os.listdir(ship_dir):
filename = ship_dir + ‘/’ + file
training_data.append((filename, ‘ship’))
for file in os.listdir(iceberg_dir):
filename = iceberg_dir + ‘/’ + file
training_data.append((filename, ‘iceberg’))
func = ImageClassificationFunction.new(“IsShipOrIceberg”, user)
func.create_samples(training_data)
```
3. Try out the model
After the model finishes training, we can check its performance and see that it correctly identified 633 out of 753 icebergs as “iceberg” (84.1%) and 714 out of 851 ships as “ship” (83.9%).
Once you’ve trained your initial model, you can continuously improve your model by adding more data. It’s especially helpful to focus on features and data samples your model has difficulty with. For example, iceberg shapes that the model mistakes for ships, and vice versa. When you add new labeled data to the platform, Nyckel automatically retrains your model.
Additionally, you can use Nyckel’s invoke capture feature to annotate data that Nyckel thinks is important to improve the model’s performance. This feature supports active learning by automatically capturing random data and data with low-confidence predictions from the model’s invokes. After you annotate this data from Nyckel’s interface, Nyckel automatically retrains the model, ultimately helping improve your model’s performance.
Image classification using Nyckel’s UI
In addition to the Python SDK I used above, Nyckel provides a user-friendly web interface that simplifies the image classification process for users who’d prefer not to use Python code. Additionally, Nyckel’s UI can be used independently or in conjunction with the Python SDK.
Click through the walk-through below to see how I built the iceberg vs. ship image classification function with Nyckel:
Build your own custom remote sensing image classifier
Would you like to explore how Nyckel could solve your remote sensing task? Sign up for a free account or reach out to us at any time for support along the way.